Vision On Screen Showing Predictions
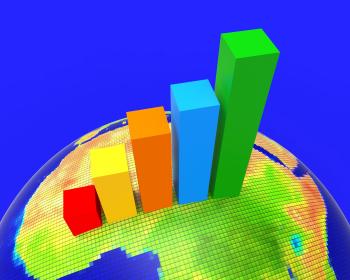
Africa Graph Indicates Financial Report And Analysis
Sun Rain Laptops Shows Weather Forecast Sunny or Raining
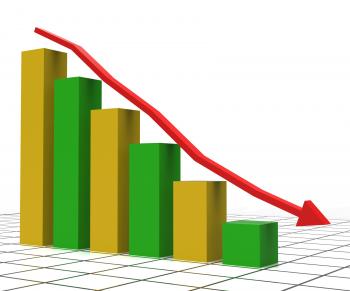
Decreasing Report Shows Graphic Analysis And Graphs
Growth File Represents Business Graph And Binder 3d Rendering
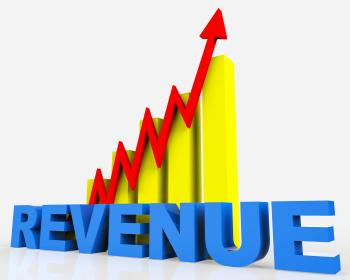
Increase Revenue Represents Business Graph And Advancing
Improve Graph Indicates Improvement Plan And Data
ata Analytics Concept
Online content marketing and web analytics concept
Web analytics concept with data icons
Web analytics concept - Multicolor version
Big Data Analytics
Target Smartphone Displays Goals Aims And Objectives
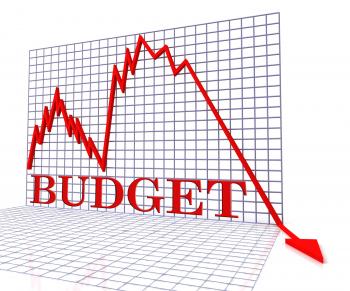
Budget Graph Negative Shows Budgeting Decline 3d Rendering
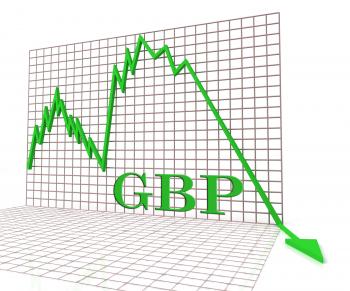
Gbp Graph Negative Shows British Pound 3d Rendering
The Stock Market Game - Bulls and Bears
Cancer Graph Indicates Cancerous Growth And Diagram
Goals Targets Indicates Aspirations Objectives And Forecast
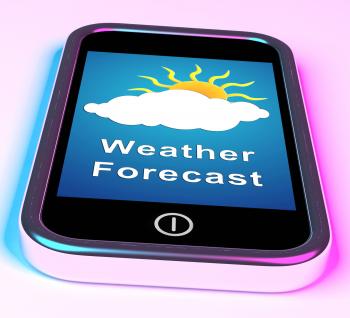
Mobile Phone Shows Cloudy Sun Weather Forecast
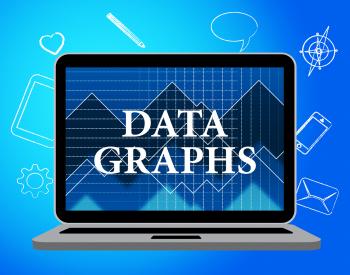
Data Graphs Means Statistical Diagram And Bytes
New Year Represents Two Thousand Eighteen And Celebrating
Cloud upload concept
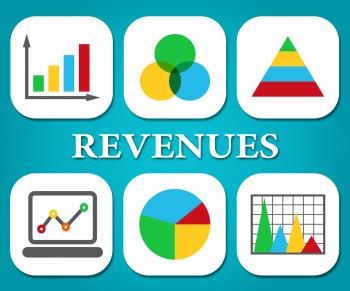
Revenues Charts Represents Business Graph And Salary
Graph Report Shows Infograph Finance And Graphic
Now Time Shows At The Moment And Earlier
Big Discount Indicates Cut Rate And Data
Mobile Smartphone Shows Rain Weather Forecast
Prices Increase Represents Financial Report And Diagram
Bad Weather Ahead Sign Shows Dangerous Prediction
Bad Weather Ahead Signpost Shows Dangerous Prediction
Profit Graph Shows Sales Revenue And Return
Pie Chart Report Indicates Business Graph And Document
Data Charts Indicates Business Graph And Bytes
Targets Words Represents Projection Business And Aiming
Pie Chart Indicates Stat Graphics And Infochart
Twenty Nineteen Represents 2019 New Year 3d Illustration
Twenty Eighteen Blocks Represents Happy New Year And Kids
Profits Graph Shows Earn Investment And Diagram
Australia Weather Indicates Meteorological Conditions And Forecast
Earnings Graph Negative Indicates Wage Crisis 3d Rendering
Investment Charts Shows Business Graph And Forecast
Red Left Arrow Ahead Shows Growth
Risk Graph Shows Infochart Beware And Risky
Sun Rain Computer Mean Weather And Seasons
Graph Increasing Shows Financial Report And Advance
Budget Graph Means Costing Expenditure And Statistic
Downturn Graph Represents Market Chart And Loss 3d Rendering
Local Weather Means City Or Town Forecast